Ventilator Volume Loops
Ventilator Volume Loops
David Ray Velez, MD
Table of Contents
Pressure-Volume Loops
Pressure-Volume Loop: A Graphical Display of the Relationship Between Pressure and Volume During the Respiratory Cycle
Display
- The Graph Proceeds Counter-Clockwise When Mechanically Ventilated with Positive Pressure Ventilation
- Spontaneous Breaths Proceed in a Reverse Clockwise Fashion
- The Peak Represents the Tidal Volume (Vt) and Peak Inspiratory Pressure (PIP)
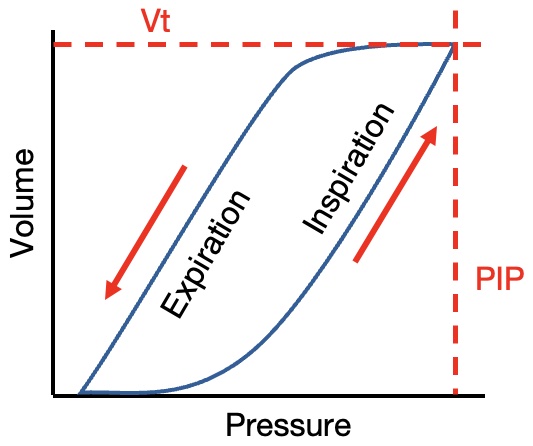
Pressure-Volume Loop
Compliance
- Compliance: Describes the Ability of the Lung to Expand in Response to Pressure Changes
- Compliance = Change in Volume / Change in Pressure = 1 / Elastance
- Elastance = Change in Pressure / Change in Volume = 1 / Compliance
- Changes in Compliance Can Be Reflected in the Pressure-Volume Loop
- Increased Compliance – Results in a Left-Shift in the Curve
- Less Pressure Required to Reach the Same Volume
- Decreased Compliance – Results in a Right-Shift in the Curve
- Greater Pressure Required to Reach the Same Volume
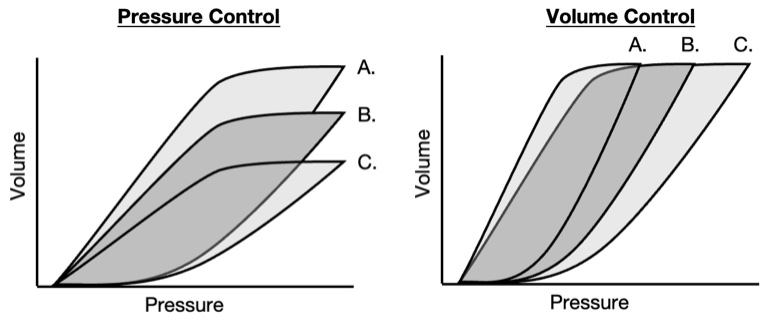
Compliance: A. Increased; B. Normal; C. Decreased
Pressure Evaluation
- Lower Inflection Point: The Point Where a Change in Slope is Seen in the Lower Inspiratory Curve
- Represents the Minimum Pressure Required for Alveolar Recruitment
- Suggested as the Set PEEP in ARDS to Maintain FRC (Debated) – Prevents Injury and Atelectrauma from Constant Collapse and Reopening
- Upper Inflection Point: The Point Where a Change in Slope is Seen in the Upper Inspiratory Curve
- Represents the Pressure at Which Regional Overdistention is Seen
- “Breaking” Point: Point Where Increased Pressure Does Not Correlate with Increased Volume
- High Risk for Injury at Pressures Above this Point
- Keep PIP Below this Point
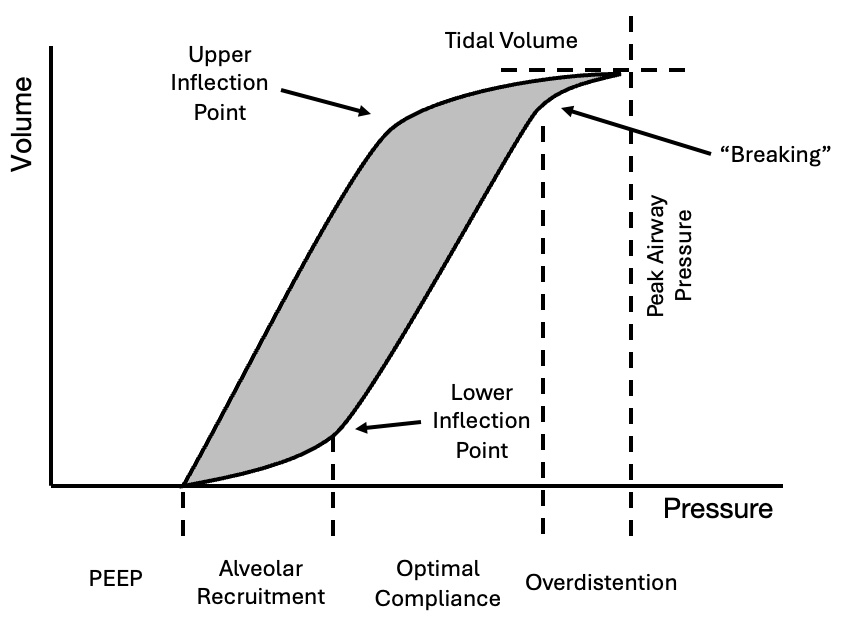
Pressure-Volume Loop
Flow-Volume Loops
Flow-Volume Loop: A Graphical Display of the Relationship Between Flow and Volume During the Respiratory Cycle
Display
- Conventionally, Inspiration is Below the X-Axis and Expiration is Above the X-Axis During Pulmonary Function Testing (PFT’s)
- Note: Ventilators Often Show the Graph Reversed with the Inspiratory Limb Above the X-Axis
- The Graph Proceeds in a Clockwise Fashion Regardless of Spontaneous or Positive Pressure Ventilation
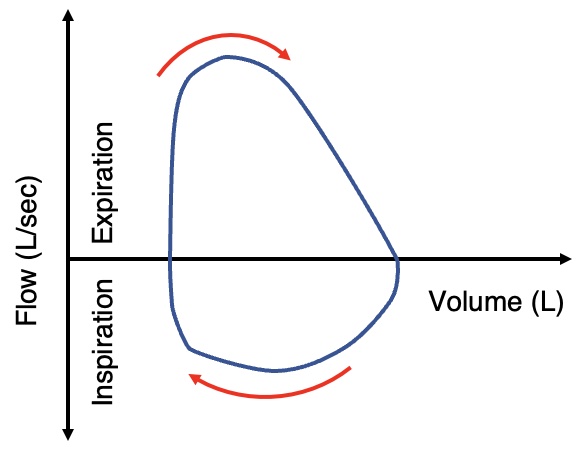
Conventional Flow-Volume Loop
Abnormal Flow-Volume Loops
- A. Normal
- B. Variable Extra-Thoracic Obstruction
- Flattened Inspiration
- Causes: Unilateral Vocal Cord Dysfunction, Mobile Tumors (Lipoma)
- C. Variable Intra-Thoracic Obstruction
- Flattened Expiration
- Causes: Tracheomalacia, Bronchogenic Cysts
- D. Fixed Upper Airway Obstruction
- Flattened Inspiration and Expiration
- Causes: Tracheal Stenosis, Goiter, Rigid Mass
- E. Lower Airway Obstruction
- “Scooped Out” Expiration
- Causes: COPD, Asthma
- F. Restriction
- Normal Shape with Reduced Volume
- Causes: Fibrosis, Sarcoidosis, Restrictive Lung Disease

Abnormal Flow-Volume Loops
Dynamic Hyperinflation (Air Trapping)
- Flow-Volume Loops Can Be Used to Assess for Air Trapping
- Air Trapping Will Be Seen When Expiratory Flow Rate Fails to Return to Zero
- *See Dynamic Hyperinflation (DHI)
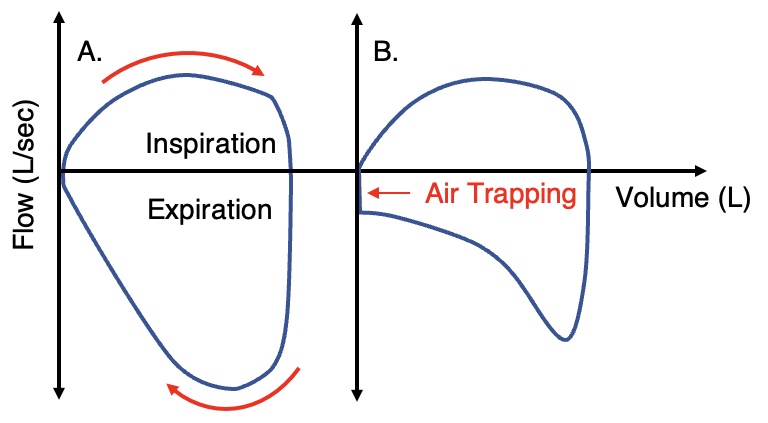
Flow-Volume Loops on a Ventilator: A. Normal; B. Obstructive Pattern with Air Trapping (Fails to Return to Zero)
