Oxygen Delivery (DO2)
Oxygen Delivery (DO2)
David Ray Velez, MD
Table of Contents
Oxygen Delivery (DO2)
Oxygen Delivery (DO2) = CaO2 x CO
Cardiac Output (CO)
- CO = Heart Rate (HR) x Stroke Volume (SV)
- Factors that Increase Stroke Volume:
- Increased Preload (End-Diastolic Volume)
- Increased Contractility
- Decreased Afterload
- *See Hemodynamic Physiology
Arterial Oxygen Content (CaO2)
- CaO2 = (Hgb x SaO2 x 1.34) + (PaO2 x 0.003)
- Hgb: Hemoglobin
- Oxygen Carrying Capacity = 1.34
- SaO2: Percent Arterial Oxygen Saturation of Hgb
- SpO2: Peripheral Oxygen Saturation is Detected on Pulse Oximeter and Used to Estimate SaO2
- PaO2: Partial Pressure of Dissolved Oxygen in Blood (Oxygen Tension)
Level of Importance
- Hemoglobin is Generally the Most Clinically Significant Determinant of Arterial Oxygen Content (CaO2)
- SaO2 Has the Same Impact as Hemoglobin but Generally Has Less Variance
- PaO2 is the Least Important Measure and Only Contributes 1-2%
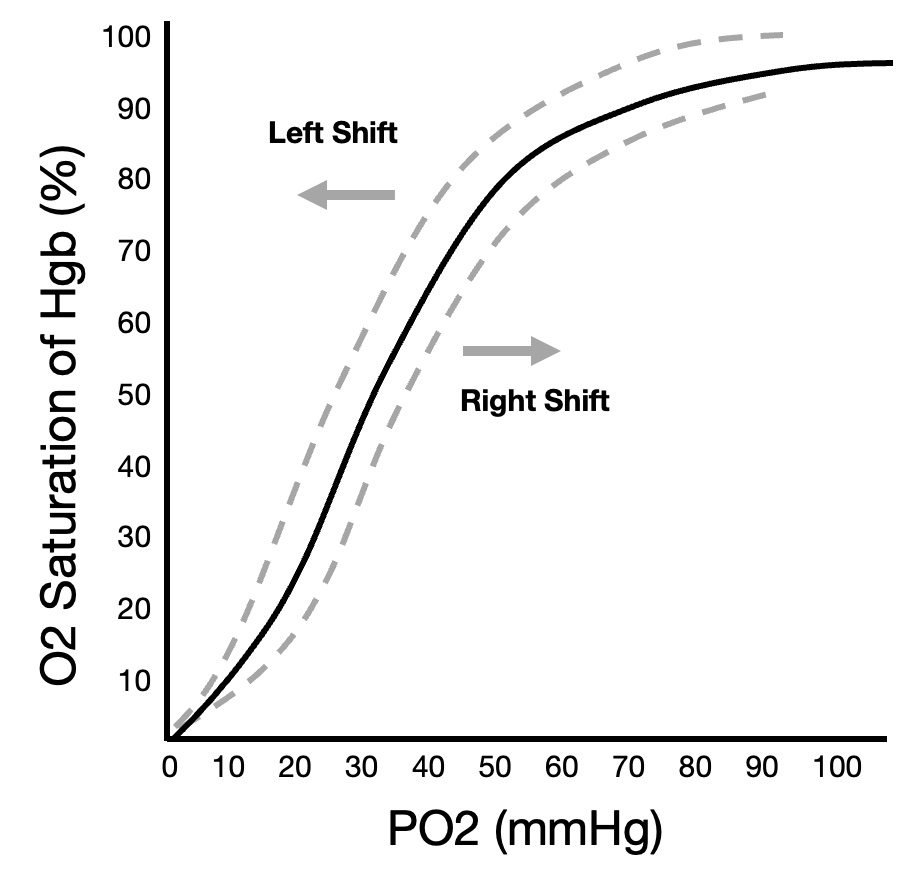
Oxygen-Hemoglobin Dissociation Curve
- Compares Partial Pressure of Oxygen (PaO2) to Percent Oxygen Saturation of Hemoglobin (SaO2)
- Shifts:
- Left Shift – Increased Affinity Supports O2 Binding
- Right Shift – Decreased Affinity Causes O2 Unloading
- Factors that Cause a Leftward Shift:
- Decreased CO2
- Decreased Temperature
- Decreased H+ (Increased pH)
- Decreased 2,3-Diphosphoglycerate (DPG)
- Carbon Monoxide Exposure – Increases Affinity at Other Binding Sites
- Factors that Cause a Rightward Shift:
- Increased CO2
- Increased Temperature
- Increased H+ (Decreased pH)
- Increased 2,3-DPG (2,3-Diphosphoglycerate)
- Hypoxia Further Decreases Oxygen Affinity Due to 2,3-DPG Having Increased Affinity for Deoxygenated Hemoglobin
- Fetal Hemoglobin Has a Low Affinity for 2,3-DPG Resulting in Overall Higher Affinity for Oxygen
- *See Oxygen-Hemoglobin Dissociation Curve
Alveolar-Arterial (A-a) Gradient
- Evaluates the Degree of Shunting and V/Q Mismatch to Help Determine the Cause of Hypoxia
- A-a Gradient = PAO2 – PaO2
- PAO2: Alveolar Partial Pressure of Oxygen
- PaO2: Arterial Partial Pressure of Oxygen
- PAO2 = FiO2 x (PATM – PH2O) – PaCO2/RQ
- PATM = Atmospheric Pressure
- PH2O = Water Vapor Pressure (Usually 47 mmHg)
- RQ = Respiratory Quotient (Usually 0.8)
- *See Alveolar-Arterial (A-a) Gradient

Oxygen-Hemoglobin Dissociation Curve
Oxygen Consumption (VO2) and Oxygen Extraction Ratio (O2ER)
Oxygen Consumption (VO2)
- VO2 = (CaO2 – CvO2) x CO
- CO: Cardiac Output
- CaO2: Arterial Oxygen Content
- CvO2: Venous Oxygen Content
Venous Oxygen Content (CvO2)
- CaO2 = (Hgb x SvO2 x 1.34) + (PvO2 x 0.003)
- Hgb: Hemoglobin
- Oxygen Carrying Capacity = 1.34
- SvO2: Mixed Venous Oxygen Saturation of Hgb
- Generally Measured from a Pulmonary Artery Catheter
- True Value Would Be at IVC and Coronary Sinus
- Normal: 70-75%
- Highest in the Renal Veins (80%)
- Lowest in the Coronary Sinus (30%)
- ScvO2: Central Venous Oxygen Saturation
- Drawn from a Central Venous Catheter to Estimate SvO2
- Approximately 3-5% Higher than SvO2 (Does Not Include Coronary Sinus Return)
- PvO2: Partial Pressure of Dissolved Oxygen in Venous Blood
Oxygen Extraction Ratio (O2ER)
- Oxygen Extraction Ratio Describes the Ratio of Oxygen Consumption (VO2) to Delivery (DO2)
- O2ER = VO2 / DO2
- VO2 = (CaO2 – CvO2) x CO
- DO2 = CaO2 x CO
- Therefore: O2ER = (CaO2 – CvO2) / CaO2
- Normal Values:
- VO2: 120-170 mL/min/m2
- DO2: 500-600 mL/min/m2
- Critical Value: 330 mL/min/m2 – Level at Which Oxygen Uptake Begins to Decline Causing an “Oxygen Debt”
- O2ER: 25-30%
- O2ER is Highest in the Coronary Circulation (> 60%) and Brain Tissue
- Elevated O2ER Indicates Inadequate Oxygen Delivery or Increased Consumption
- Oxygen Delivery:Consumption Ratio: 4:1
Evaluating Oxygenation
Arterial Blood Gas (ABG)
- Generally Measures and Reports PaO2 (What is Used in P:F Ratio, etc)
- May Also Measure SaO2
- ABG Challenges:
- Expensive, Painful, and Time Consuming
- Blood Loss
- May be Contaminated with Venous Blood
- Although a Better Measure of Lung Function, Pulse Ox Better Measures Systemic Delivery
- Often Misinterpreted – (SpO2 of 88% Correlates with PaO2 of 55 mmHg)
- *See Reading an Arterial Blood Gas (ABG)
Pulse Oximeter (Pulse Ox)
- Detects SpO2
- Pulse Ox Challenges:
- May Have a Bias of +2% in Dark Skin
- Requires Pulse Detection in Peripheral Circulation – May Be Abnormal in Shock or Hypothermia
- Generally Not Accurate Once Below 70%
- Falsely Elevated in Carbon Monoxide Poisoning
ABG vs Pulse Ox
- Pulse Oximetry (SpO2) is Generally Superior to ABG (PaO2) in Measuring Oxygenation
- When ABG is Preferred:
- If Pulse Oximeter Waveform is Unreliable
- For P/F Ratio Calculation in ARDS
- Diagnosis of Methemoglobinemia
Venous Blood Gas (VBG)
- Sources:
- Peripheral – From Peripheral Veins
- Central Venous – From a Central Line
- Mixed Venous – From a Pulmonary Artery Catheter
- Benefits Over ABG:
- Easier to Obtain
- Less Painful
- Can Be Obtained While Sampling Other Lab Tests
- Lower Risk of Complications (Hematoma, Dissection, Thrombosis)
- Challenges:
- ABG is Still Considered the Gold Standard Blood Test in Evaluating Oxygenation, Ventilation, and Acid-Base Status
- VBG is Generally Less Well Validated than an ABG
- VBG and ABG May Have Worse Agreement in the Presence of Severe Circulatory Failure/Hypotension
- VBG May Correlate to ABG Better for pH and pCO2 than for PaO2 or SaO2
General Target Values
- SaO2/SpO2 > 92% (88% in COPD or ARDS)
- PaO2 > 60 mmHg (55 mmHg in COPD or ARDS)
- ScvO2 > 70%
Hypoxic Definitions
- Hypoxemia: Low Oxygen Content in Blood
- Hypoxia: Low Oxygen Content in Tissues
